
Author name: Catalyst Marketing

Blog

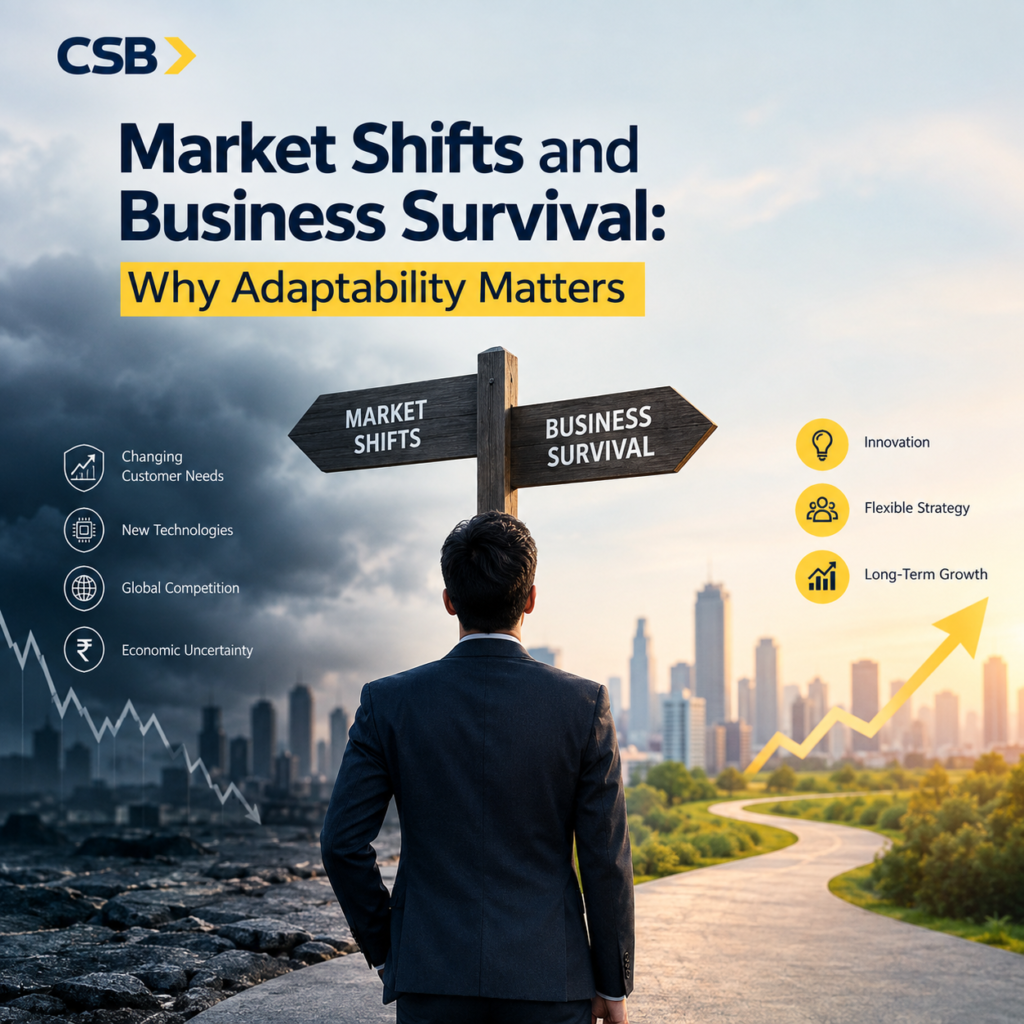
Market Shifts and Business Survival: Why Adaptability Matters

Every business eventually runs into a moment when the rules it was built on stop applying. A competitor changes the pricing model, a new technology makes the old process irrelevant, customer expectations move somewhere the product hasn’t followed. Market shifts and business survival are really the same conversation, because it’s rarely the strength of a business at its peak that determines whether it lasts; it’s how quickly that business notices the ground has moved and changes with it. Why Size and Success Don’t Protect a Business From This There’s a comfortable assumption that a large, established, profitable company is somehow insulated from the need to adapt, that scale itself is a kind of shock absorber. The data doesn’t support that. Corporate longevity research from Innosight has tracked a steady collapse in how long companies actually stay on the S&P 500, from an average tenure of roughly 33 years in the mid-1960s down to somewhere in the range of 12 to 18 years more recently, with the firm projecting that around half of the current index could be replaced within a decade. Being big, profitable, and well known in a given year says almost nothing about whether a company will still be relevant a decade later. What separates the ones that last from the ones that don’t tends to have far less to do with size and far more to do with how the organisation behaves the moment the market underneath it starts to move. What Failing to Adapt Actually Looks Like It rarely shows up as a single dramatic collapse. It shows up as a slow refusal to update a business model while the evidence keeps arriving. Research summarised by business-failure analysts consistently names the inability to respond to changing market conditions, shifting demand, and new competition as one of the recurring, well-documented reasons companies close, alongside cash flow problems and a lack of genuine market demand. The pattern tends to follow a familiar shape: a firm’s historical way of operating has worked for years, so leadership treats new competitive pressure as temporary noise rather than a signal, and by the time the decline is undeniable, the company is too far behind to close the gap. The Case Studies That Made This Impossible to Ignore Two companies get cited more than any others in this conversation because they illustrate the same market shift producing opposite outcomes for two direct competitors. Kodak had access to early digital camera technology of its own yet struggled to make the transition from film to digital in time, while Fuji, facing the identical technological shift, adapted its business and grew into a multi-billion-pound company. The lesson isn’t that Kodak lacked the technology; it’s that possessing the capability to change and actually acting on it in time turned out to be two very different things. Blockbuster followed a similar arc against streaming: the shift in how people wanted to consume video was visible well before it became fatal, and the company that recognised and acted on it early captured the market the incumbent had built. Why the Cost of Waiting Keeps Rising Financial and management research on corporate longevity points to an accelerating churn rate rather than a stable one, meaning the window a business has to notice a shift and respond to it is narrower today than it was for the previous generation of companies. A slow reaction time that might once have cost a company a few points of market share now risks costing it the business entirely, because competitors, technology, and customer expectations are all capable of moving faster than they used to. Waiting for total certainty before responding to a market shift isn’t a cautious strategy anymore; it’s a way of guaranteeing the response arrives too late to matter. Why Adaptability Is a Capability, Not a Personality Trait It’s tempting to treat adaptability as something a company either has baked into its culture or doesn’t, but that framing lets leadership off the hook too easily. Adaptability is closer to a discipline than a disposition; it’s built through specific habits rather than inherited through founder personality. Companies that navigate market shifts well tend to share a few concrete practices: they track leading indicators of change rather than waiting for lagging ones like revenue to confirm a shift has already happened, they give a small amount of resourcing to experiments outside the core business before those experiments are strictly necessary, and they build decision-making processes where a mid-level employee’s observation that something’s changing in the market can actually reach leadership without being filtered out along the way. None of that requires a company to abandon what’s working. It requires building the muscle to notice early and move before the shift has already done its damage. Recognising a Shift While There’s Still Time to Respond The businesses that adapt successfully rarely do so because they had better information than everyone else; they usually just paid attention to information that was already available. A drop in customer engagement that doesn’t recover the way past dips did, a new entrant pricing a comparable offering well below the market average, a steady trickle of customers citing the same unmet need in feedback: these are the early, unglamorous signals that a market is moving. The businesses that survive shifts tend to treat these as worth investigating immediately rather than waiting for the trend to show up unmistakably in the quarterly numbers, by which point the company reacting is usually already behind whoever reacted first. Building Adaptability Into How a Business Actually Runs Adaptability that only shows up during a crisis isn’t really adaptability; it’s damage control. The more durable version gets built into the ordinary rhythm of the business: a regular review of what’s changing in the competitive landscape and customer base, a habit of piloting small changes rather than treating every shift as an all-or-nothing bet on the future, and enough slack in the budget and the team’s time that responding to something new doesn’t require cancelling
Blog

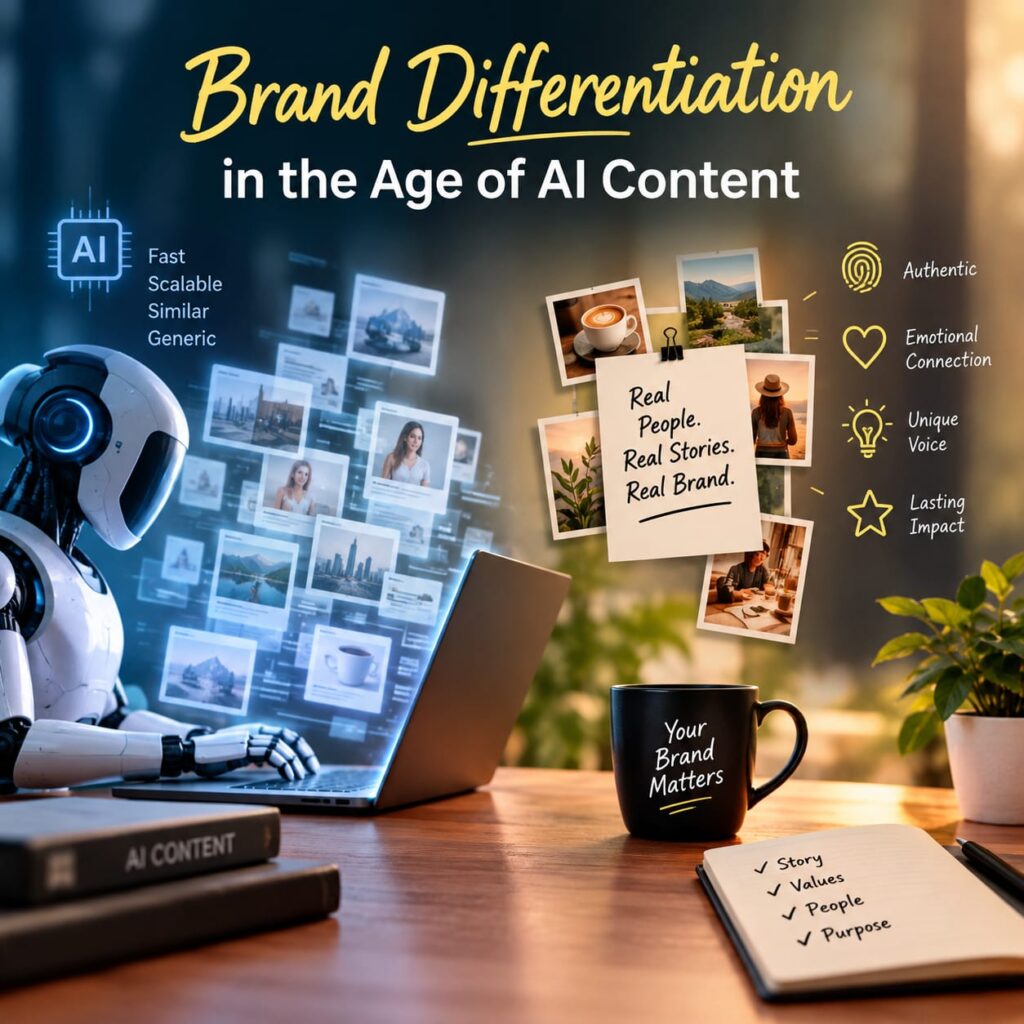
Brand Differentiation in the Age of AI Content

Polished copy, a consistent brand voice, and professional-looking content used to be enough to signal quality. Now every competitor can produce all three in minutes, which means none of them differentiates a brand anymore. Brand differentiation in the age of AI content has shifted onto entirely different ground, and 2026 consumer research is unusually specific about where that ground actually is. The Trust Collapse Behind This Question Consumer sentiment toward AI-generated brand content has moved fast, and not in the direction most marketing teams hoped. Only 26 per cent of consumers now prefer generative AI creator content over traditional creator content, down sharply from 60 per cent in 2023, and separate 2026 research surveying 2,149 consumers across Canada and the US found 87 per cent believe the content they see from brands is at least partly AI-generated, while only 13 per cent feel confident they could actually tell the difference. That gap, near-universal suspicion paired with almost no ability to verify it, is the actual environment brand differentiation in the age of AI content now has to operate inside. Why AI Content Converges Toward the Same Output This suspicion isn’t paranoia; it reflects something genuinely happening to the content itself. Because most brands draw on the same handful of foundational AI models, outputs regress toward a statistical average, since these models function as consensus engines predicting the most probable next word rather than generating a genuinely novel or contrarian point of view, a pattern industry analysts have started calling content slop or model collapse. The practical result is blog posts, ad copy, and social captions across competing brands that are structurally difficult to tell apart, not because any single piece is badly written, but because every piece was optimised toward the same statistical middle. What Actually Differentiates a Brand Now The same 2026 consumer research that found near-universal AI suspicion also identified what still moves the needle despite it. Product quality and real customer stories were identified as the two most effective ways a brand stands out today, at 38 per cent and 31 per cent respectively, and while 79 per cent of consumers say they prefer authentic brands, researchers are explicit that authenticity itself has stopped being a competitive advantage and has become a baseline expectation instead. In other words, sounding authentic no longer separates a brand from its competitors, since every brand’s AI tools can now produce content that sounds authentic on the surface. What separates a brand is verifiable evidence, an actual product performing as claimed, an actual customer with an actual story, that AI-generated polish alone can’t fabricate convincingly. Why Disclosure Backfires Less Than Hiding A specific, counterintuitive finding is worth building directly into content strategy rather than treating as a minor detail. 2026 UK consumer research from Mintel found brands that are transparent about their AI use are rated as more trustworthy, while the inverse carries a much steeper cost: consumers who discover undisclosed AI use respond with a trust collapse that damages every prior interaction with that brand, not just the specific piece of content in question. The instinct to hide AI involvement, out of a fear that admitting it looks lazy or inauthentic, is measurably the wrong instinct according to this research. Being caught hiding it does far more damage than being open about using it in the first place. The Content That’s Actually Hard to Replicate Industry analysis of what’s actually still working points toward a specific, testable filter rather than a vague call for more creativity. The content formats consistently outperforming in 2026 share one characteristic: they’re built on information that cannot be scraped, rephrased, and replicated by a competitor at zero cost, original research, proprietary data, direct firsthand experience, or a genuinely specific point of view nobody else in the category has actually stated plainly. A generic explainer on a common industry topic is exactly the kind of content every competitor’s AI tool can produce at similar quality within minutes. A finding from a brand’s own data, a documented result from an actual customer, or a genuinely contrarian take on an industry assumption is not something a competitor’s AI tool can replicate without doing the same underlying work first. Where Consumers Are Most on Guard Not every category of content carries the same level of AI suspicion, and knowing where scrutiny concentrates matters for where to invest the extra verification effort first. The same 2026 consumer research found people are most concerned about AI involvement specifically in health content, financial content, customer testimonials, and behind-the-scenes material, categories where the content is implicitly making a claim about truth or lived experience rather than simply describing a product. A blog post explaining a general concept carries relatively low stakes if it turns out to be AI-assisted. A customer testimonial or a behind-the-scenes look that turns out to be fabricated or AI-generated carries a much steeper trust cost, precisely because those formats are implicitly promising something real rather than something merely well-written. What This Means for Brand Content Strategy None of this argues for abandoning AI tools, since the research is detailed; the problem isn’t AI assistance itself, it’s relying on AI for ideation and differentiation rather than execution alone. Investing human effort specifically in the parts of content that create genuine differentiation, original data, real customer documentation, and a stated point of view, while using AI to handle drafting, formatting, and production efficiency, keeps the speed advantage without sacrificing the substance that actually earns trust. Being explicit and upfront about where AI was used in a piece of content, rather than treating that disclosure as an admission of weakness, aligns directly with the trust data above rather than against it. And auditing existing content against the specific question of whether a competitor’s AI tool could produce something nearly identical is a fast, concrete way to identify which pieces of a brand’s output are actually doing differentiation work and which are just adding to the same undifferentiated volume everyone else is producing.

Blog

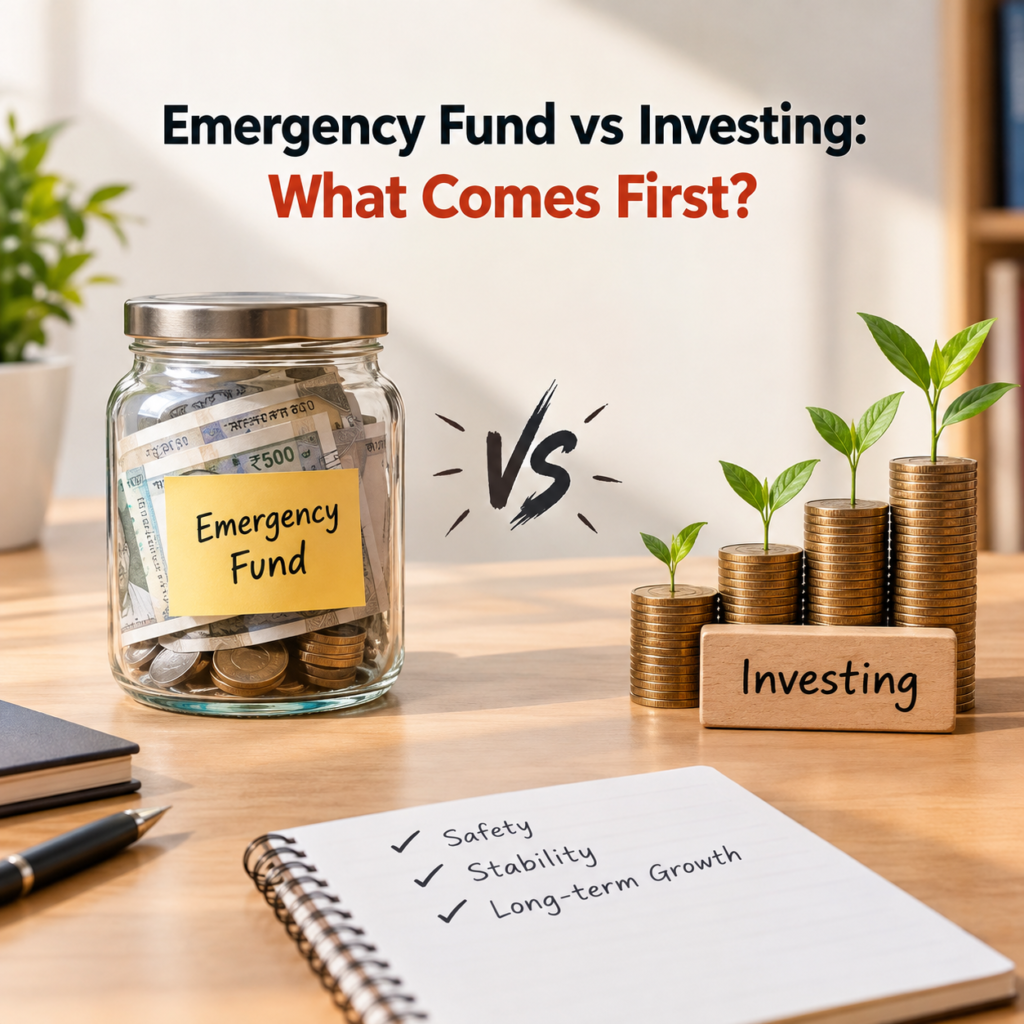
Emergency Fund vs Investing: What Comes First

The stock market has historically returned far more over time than a savings account ever will, which makes it tempting to skip the emergency fund entirely and put everything toward investing instead. Emergency fund vs investing framed as a competition between two returns is actually comparing two things built for entirely different jobs, and the sequencing mistake that comparison leads to is a common, costly one. Why This Isn’t Actually a Fair Comparison The logic behind skipping an emergency fund usually goes something like this: the stock market returns roughly 10 per cent a year on average, a savings account earns a few per cent, so why would anyone choose the lower return? Financial writers addressing this exact question point out the comparison is flawed at its foundation: an emergency fund is insurance, not an investment, and its job is protecting against forced selling, not maximising return, which means comparing its yield to stock market returns is comparing two tools built for entirely different purposes. Insurance that never gets used isn’t a wasted purchase, and an emergency fund that sits untouched for years isn’t underperforming. It’s doing exactly the job it was built for. What Happens When the Emergency Fund Is Missing The risk an emergency fund actually protects against becomes clear the moment an unexpected expense meets an all-in investment position. Bankrate’s 2026 Emergency Savings Report found 59 per cent of Americans cannot cover a 1,000 dollar emergency expense without going into debt, which means for a majority of people without a cash buffer, an unexpected car repair or medical bill has only two realistic sources: a credit card or selling investments, potentially at a loss, at whatever moment the emergency happens to occur. Neither option is available to someone with a properly sized emergency fund, since the whole point of the fund is removing the need to choose between debt and a forced, badly timed sale in the first place. The Market Math That Makes Forced Selling So Costly Forced selling is expensive specifically because of how unevenly stock market returns actually arrive within a given year. The average intra-year decline in the S&P 500 since 1980 has been around 14 per cent, even though the index still finished positive in roughly 75 per cent of those years, meaning a meaningful drop at some point during the year is closer to normal than exceptional, and the investor forced to sell during exactly that dip locks in a loss the market itself would likely have recovered from if given time. An emergency fund’s entire function, from this angle, is making sure a real-life emergency never has to coincide with the worst possible moment in that year’s market cycle. How Big Should the Buffer Actually Be The standard guidance for a working-age emergency fund is three to six months of essential expenses held separately from any investment account, sized to cover the kind of income disruption or unexpected cost most people are realistically likely to face during their working years. That target shifts meaningfully closer to retirement, where the stakes of forced selling are considerably higher. Financial advisors increasingly recommend retirees hold one to two years of expenses in cash specifically, since a market downturn early in retirement forces a larger proportion of a portfolio to be sold to generate the same income, permanently locking in losses in a way a working person still earning wages doesn’t face in the same way. Why Having the Fund Actually Lets You Invest More Aggressively Counterintuitively, a solid emergency fund tends to support more investing, not less, once it’s in place. Financial planners covering this exact tradeoff describe the buffer as the reason a systematic investment plan actually survives a downturn rather than its rival, since a properly funded cash reserve is what lets an investor watch a real market decline happen without needing to touch the portfolio at all. Emergency fund vs investing isn’t really a sequencing conflict once framed this way. The fund is what removes the emotional and financial pressure that causes panic selling at the worst possible moment, which is precisely the behaviour that turns a paper loss into a permanent one and does the most damage to long-term investment returns. There’s a psychological piece to this too: knowing a real cushion exists tends to change how someone actually responds to a portfolio statement showing red numbers, since the decision to sell or hold stops being made under financial duress and becomes one made with an actual clear head. When It Actually Makes Sense to Invest Before the Fund Is Full The three-to-six-month target isn’t a rigid rule that overrides every other financial consideration, and financial advisors are clear that the right approach depends on someone’s overall position rather than a single fixed number. Someone with stable, predictable income, an employer match on a retirement account that would otherwise go unclaimed, and relatively low fixed obligations has a reasonable case for building a smaller starter fund while still capturing free matching contributions, since walking away from a full employer match to build an oversized cash buffer trades a guaranteed return for a marginal amount of extra safety. The exception that advisors flag as genuinely risky is the opposite position: someone with heavy investment exposure, little to no liquid cash, and real financial dependents or fixed monthly obligations, where the absence of any buffer at all creates real fragility regardless of how well the underlying investments happen to be performing. A Practical Sequence for Building Both None of this means investing has to wait until an emergency fund is fully built before a single dollar goes toward it. A reasonable approach starts with a smaller starter buffer, enough to cover an immediate, common expense, before splitting further contributions between finishing the emergency fund and beginning to invest, since both goals can progress in parallel rather than strictly sequentially. Keeping the fund itself in an accessible, low-risk account, a high-yield savings account or a short-duration instrument, rather than anywhere connected

Blog

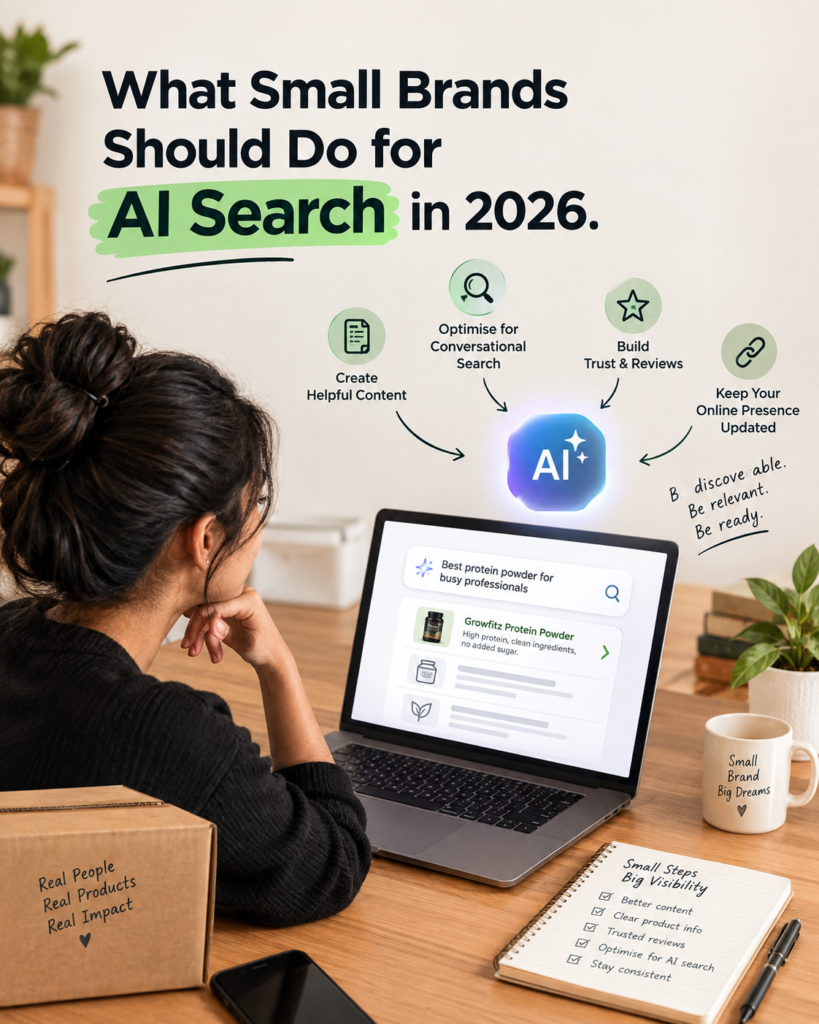
What Small Brands Should Do for AI Search in 2026

Customers are increasingly asking ChatGPT or Google’s AI Overviews to recommend a business rather than scrolling through a list of search results themselves, and most small brands haven’t changed anything about how they show up online in response. What small brands should do for AI search starts with recognising how fast this shift has moved and how unevenly prepared businesses actually are for it. How Fast This Shift Is Actually Moving: What Small Brands Should Do for AI Search The scale of the gap between adoption and preparedness is the most useful starting statistic here. A 2026 research study covering 1,600 small business accounts and cross-referenced against eight industry reports spanning more than 200,000 businesses found that 35 per cent of consumers now use AI to find a local business or service, AI search traffic grew 527 per cent in a single year, and 88 per cent of businesses currently have no strategy at all for appearing in AI search results. That last number is the one worth sitting with. This isn’t a channel most competitors have already mastered. It’s one nearly nine in ten businesses haven’t started addressing at all, which makes early, even modest effort disproportionately valuable right now. Why Local Searches Behave Differently Than Informational Ones It’s worth understanding that AI search doesn’t affect every type of query the same way, since local business searches show a genuinely different pattern than general informational ones. Local intent searches trigger a Google AI Overview at just 7 per cent, compared to 88 per cent for informational queries, a gap researchers are clear doesn’t mean AI search is less relevant for local businesses, just that it shows up differently, more often through direct chatbot recommendations and voice-style queries than through the AI Overview box on a traditional search results page. A small brand optimising purely for AI Overview visibility while ignoring how a chatbot like ChatGPT actually answers a local recommendation question is optimising for the wrong surface for a meaningful share of its actual customer searches. The Click Problem: Being Cited Doesn’t Automatically Mean Being Visited Even a genuine mention inside an AI answer doesn’t behave like a traditional search result, and the click math is worth understanding before investing heavily in this channel. Roughly 93 per cent of AI search sessions end without a website click at all, and AI Overviews reduce clicks to the top-ranking traditional result by 58 per cent, a shift that has already measurably reduced organic traffic across the web. The upside worth weighing against that: organic click-through rate runs 35 per cent higher specifically when a brand is cited inside an AI Overview, and 52 per cent of users click through to a source after receiving an AI recommendation that references it, meaning the businesses that do get cited see meaningfully better engagement from the traffic that does arrive, even as overall click volume across the web declines. What Actually Gets a Small Brand Cited The good news buried in this data is that citation isn’t purely a function of size or budget the way traditional page-one rankings often were. While domain authority remains the single strongest predictor of AI citations overall, with high-traffic sites earning roughly three times more citations than low-traffic ones, 40 per cent of sources cited inside AI Overviews rank in positions 11 to 20 on a traditional search results page, meaning a business that would never crack the top 10 on Google can still be pulled into an AI-generated answer if its content structure and authority signals are strong enough. Freshness matters more here than in traditional SEO too: content updated within the past two months earns 28 per cent more AI citations than older content, and pages built around clear statistics, citations, and direct quotations achieve 30 to 40 per cent higher visibility in AI-generated responses than pages without them. What Small Brands Should Actually Do Differently Put together, this points toward a specific, achievable set of changes rather than a wholesale rebuild of a brand’s online presence. Structuring content around clear, directly answerable questions, the exact format AI systems pull from most reliably, matters more here than the keyword-density tactics traditional SEO rewarded. Keeping core pages, service descriptions, FAQs, location and hours information, updated on a regular cadence rather than left untouched for years taps directly into the freshness advantage described above. Building a real presence across third-party surfaces, review platforms, YouTube, and directory listings, spreads a brand’s authority signal across more of the sources AI systems actually pull citations from, rather than depending entirely on a single website ranking well. And adding genuine data points, statistics, sourced facts, and direct quotes into content specifically, rather than generic marketing copy, is the single change with the clearest, most measurable citation benefit in the data above. How This Compares to Traditional SEO, Not a Replacement for It It’s worth being direct about how this fits alongside a small brand’s existing search strategy rather than replacing it outright. Google organic search traffic declined only about 2.5 per cent year over year, a modest dip rather than a collapse, and Google alone still handles an estimated 16.4 billion searches per day, meaning traditional search remains, by a wide margin, the larger channel a small brand needs to keep investing in. Abandoning search engine optimisation to chase AI visibility exclusively would mean walking away from the channel still doing most of the work in favour of one that’s growing fast but starting from a much smaller base. The realistic approach treats AI search as an additional surface layered on top of solid traditional SEO fundamentals, not a wholesale replacement for them, since the same freshness, structure, and authority signals that help a page rank traditionally are largely the same signals AI systems pull citations from in the first place. Why Waiting Isn’t a Neutral Choice The 88 per cent figure cuts both ways, and it’s worth being honest about which direction it points for a business that does nothing.

Blog

Customer Ownership in E-Commerce: Who Really Has It

A seller can process thousands of orders through a marketplace and still not actually know who bought the product, what else they might want, or how to reach them again without paying the platform for the introduction a second time. Customer ownership in e-commerce isn’t a philosophical question; it has a contractual answer on most marketplaces, and it’s one a lot of sellers never actually read before building their entire business on top of it. Why This Has a Contractual Answer, Not Just a Practical One On most major marketplaces, the seller agreement is explicit that the platform, not the individual seller, controls the customer relationship. Buyer contact details typically arrive masked or order-specific, email addresses that route through the platform rather than a seller’s own system, and marketplace terms of service generally prohibit sellers from using that contact information for marketing outside the platform. A seller who has sold thousands of units through a marketplace often has no usable list of who bought them, no way to email a past customer about a new product, and no contractual right to build one from that data even if they wanted to. The relationship, legally and structurally, belongs to the platform that hosted the transaction. The Retention Math That Makes This Expensive to Ignore The financial stakes behind this distinction are large enough that treating it as a minor operational detail is a mistake. Existing customers convert at 60 to 70 per cent compared to just 5 to 20 per cent for new prospects, and returning customers generate roughly 60 per cent of direct-to-consumer brand revenue, yet the average retention rate across DTC brands sits at just 28.2 per cent, meaning most of that high-value repeat business is being left on the table rather than actively captured. A seller who never owns the customer relationship never gets the chance to improve that retention number at all, since every single sale, repeat or not, has to be re-earned through the platform’s own discovery mechanism and, usually, its advertising fees. Why Loyalty Programs Widen the Gap Further The advantage compounds specifically for sellers who can build a direct relationship and choose to invest in it. Brands with active loyalty programs see 20 to 30 per cent of revenue coming from repeat buyers, compared to just 8 to 12 per cent for brands without one, a gap that only exists at all for sellers who have a channel to actually run a loyalty program on, something a pure marketplace listing structurally doesn’t allow. Customer ownership in e-commerce isn’t just about knowing who bought a product. It’s a prerequisite for every retention tool- loyalty programs, personalised email, targeted win-back campaigns- that depends on being able to reach a past customer directly. The Scale of What’s Already Shifting Toward Owned Channels This isn’t a niche strategy limited to a handful of sophisticated brands. US direct-to-consumer e-commerce reached 239.75 billion dollars in 2025, accounting for 19.2 per cent of total US retail e-commerce, with the global DTC market projected to reach 319.57 billion dollars in 2026, and venture capital investors poured 4.6 billion dollars into D2C startups in 2024, a figure analysts tie directly to the margin and data advantages that come specifically from owning the customer relationship rather than renting access to it. The businesses attracting that capital aren’t necessarily abandoning marketplaces. They’re building a parallel channel specifically because the marketplace channel structurally can’t deliver the retention economics described above. What Owning the Customer Actually Requires Genuine customer ownership isn’t a mindset; it’s a specific set of assets a seller either has or doesn’t. An email or SMS list built from customers who opted in directly, not through a marketplace’s messaging system, is the core asset, since it’s the one channel a platform algorithm change or policy update can’t take away overnight. A checkout and order history a seller actually controls, whether through a branded website or a direct ordering channel, is what makes repeat purchase data usable for anything beyond a single transaction. And a communication channel that doesn’t depend on marketplace approval- an email sequence, a loyalty app, a direct messaging opt-in- is what actually converts a one-time buyer into the repeat customer the retention numbers above describe. The Direct Purchase Advantage Only Works If a Seller Delivers On It Building a direct channel doesn’t automatically solve the customer ownership problem on its own, and current DTC research flags a specific trap sellers fall into once they do set one up. Customers increasingly expect a direct purchase to feel meaningfully different from a marketplace purchase, in price, convenience, or exclusivity, and when a brand’s own site offers no real advantage over shopping the same product on a marketplace, customers see little reason to bother switching channels at all. A direct channel that exists purely as a data-collection exercise, with no loyalty perk, bundle, or pricing reason to actually use it, tends to sit unused while the marketplace listing keeps doing all the real selling. Owning the technical ability to reach a customer directly only pays off once there’s an actual reason for that customer to choose the direct channel over the one they already know. A Practical Way to Build This Without Abandoning the Marketplace Channel None of this requires walking away from marketplace sales, which still deliver real reach and discovery most sellers can’t easily replace. It means treating the marketplace as an acquisition channel rather than the entire business. Including a product insert that invites customers to a branded loyalty program or newsletter, within whatever limits the specific marketplace’s policies allow, starts building a direct list from marketplace traffic rather than losing that customer entirely once the transaction closes. Running a parallel, even modest, direct-to-consumer storefront gives a seller somewhere to actually own the next interaction, rather than depending entirely on the marketplace surfacing that seller again in a future search. And treating every marketplace sale as a single transaction rather than the start of a relationship, unless a direct channel

Blog

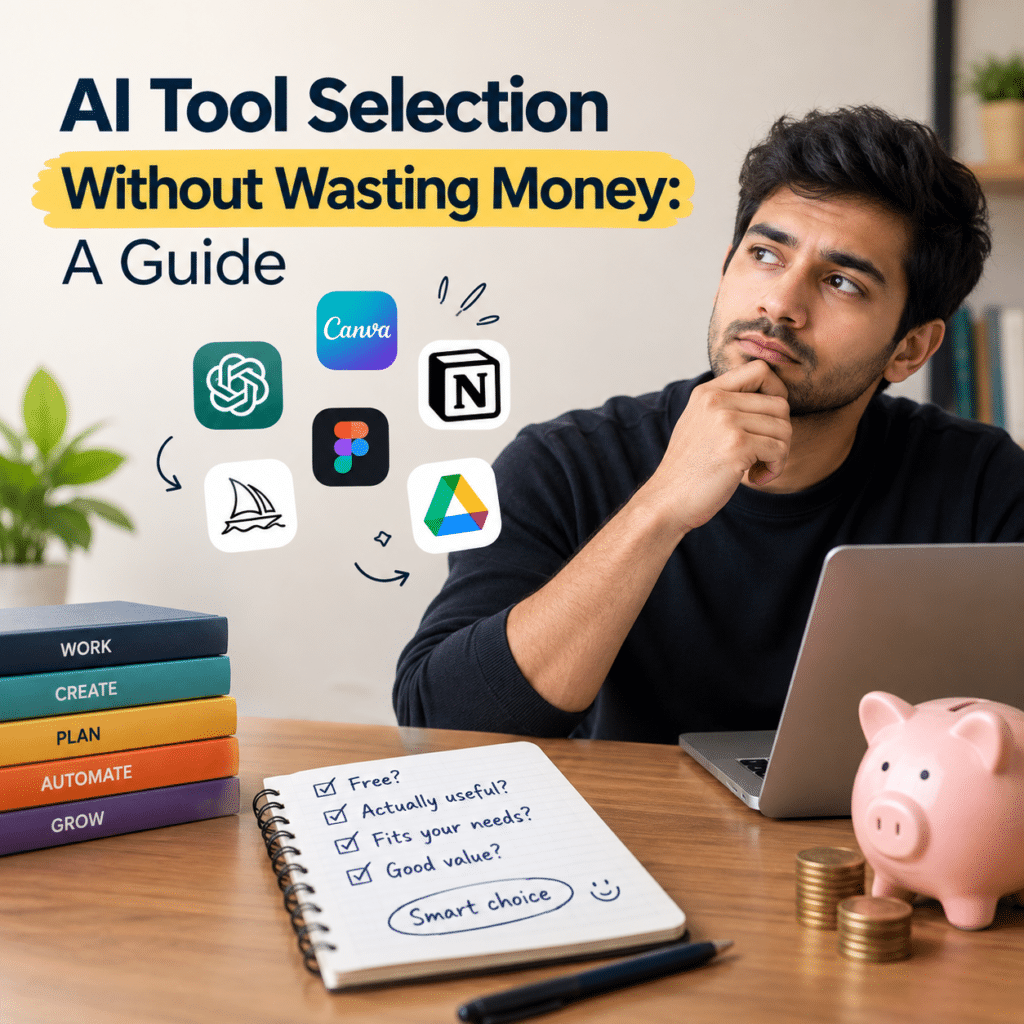
AI Tool Selection Without Wasting Money: A Guide

Every business software directory now has an AI-powered version of itself, and the pressure to pick one, any one, before a competitor does can push a purchase decision through before anyone has actually defined what the tool is supposed to accomplish. AI tool selection without wasting money starts with understanding just how often that instinct goes wrong, and 2025 and 2026 data on business AI spending is unusually blunt about it. The Scale of the Problem: Most Companies See No Return The headline number here is stark enough to reset how any business should approach this decision. McKinsey’s 2025 State of AI research found that 88 per cent of organisations now use AI in at least one business function, yet 95 per cent report no measurable return on investment, a gap researchers describe as the AI productivity paradox: heavy adoption paired with almost no measurable payoff. That gap isn’t primarily a technology problem. It’s a selection and implementation problem, and it means the odds are already stacked against any AI purchase made without a clear, specific plan for what success looks like. Why So Much of This Spend Goes to Waste The waste itself is measurable and substantial. Gartner research suggests up to 40 per cent of enterprise AI subscriptions go unused or significantly underutilised, and a separate 2025 industry benchmark found 53 per cent of all SaaS licenses, AI tools included, sit idle, amounting to roughly 21 million dollars in wasted spend annually at the average company, a figure that grew more than 14 per cent year over year even as spending on AI-native tools specifically jumped more than 75 percent in the same period. IBM’s research adds a specific mechanism behind that waste: only 16 per cent of AI initiatives ever scale beyond a pilot to genuine enterprise-wide use, often precisely because investment gets spread too thin across too many overlapping tools rather than concentrated behind a few that actually get adopted. The Real Reason Most AI Tools Fail: Buying Before Deciding Underneath the statistics sits a consistent, avoidable pattern. Businesses commonly purchase an AI tool because it looks impressive in a demo or because a competitor has one, and only afterwards try to figure out what specific problem it should solve, which is precisely backwards from how a purchase decision protects against waste. A 2026 analysis tracking cancelled and delayed enterprise AI projects found roughly one in four were cancelled or delayed specifically because of costs that hadn’t been visible at the time of purchase, a failure pattern that traces back to the same root cause: the tool was selected before the actual use case, and its true operating costs were fully defined. AI tool selection without wasting money starts by reversing that order: define the specific outcome first, then evaluate which tool, if any, actually delivers it at a cost that makes sense. Tool Sprawl Makes This Worse, Not Better The problem compounds as more tools enter the business, since each new AI tool tends to overlap with capabilities an existing one already offers, purchased by a different department that didn’t know the other existed. Worker access to AI tools grew 50 per cent year over year according to Deloitte’s 2025 State of AI in the Enterprise research, and much of that growth arrives through individual departments approving tools independently, without any central visibility into what the business as a whole is already paying for. A marketing team’s AI writing tool, a sales team’s AI call analyser, and a support team’s AI chatbot can each be individually reasonable purchases while collectively representing significant redundant spend once someone actually adds up what every department is separately paying for overlapping functionality. A Practical Framework for AI Tool Selection Without Wasting Money A specific, repeatable process closes most of the gap described above. Industry guidance on avoiding this exact failure pattern recommends defining one measurable outcome a tool should influence before committing to it, tracking that outcome consistently after adoption, and declining to renew if the metric hasn’t moved, while separately auditing existing tools by flagging any where fewer than 30 per cent of licensed users engage with it on a weekly basis as a strong signal the tool isn’t earning its subscription. This turns tool evaluation from a one-time purchase decision into an ongoing habit, which matters given how quickly new AI tools continue entering the market faster than old, underused ones get retired. Where AI Spending Actually Pays Off None of this data suggests AI tools are a poor investment across the board, and it’s worth being specific about where the exceptions actually show up. McKinsey’s same 2025 research found revenue benefits are most commonly reported in marketing and sales, strategy and corporate finance, and product and service development, the functions where AI tools are typically applied to a narrow, well-defined task rather than deployed as a general-purpose capability across an entire department. The pattern across companies that do see a return tends to look the same regardless of industry: a specific, measurable task, drafting first-pass ad copy, summarising sales calls, generating a first draft of a product spec, handed to a tool built for exactly that job, rather than a broad AI platform purchased on the assumption that value will emerge once the team figures out how to use it. How to Evaluate a Tool Before Committing to Annual Billing Annual contracts are where a bad AI tool decision becomes an expensive one rather than a cheap, correctable mistake. Starting with a monthly or usage-based plan wherever one is available, even at a modest price premium over an annual commitment, keeps the cost of a wrong decision limited to weeks rather than a full year. Running a genuine pilot with the actual team that would use the tool day to day, rather than evaluating it in a sales demo built to showcase best-case scenarios, surfaces the adoption friction that demo environments are specifically designed to hide. And checking whether a tool actually replaces an existing

Blog

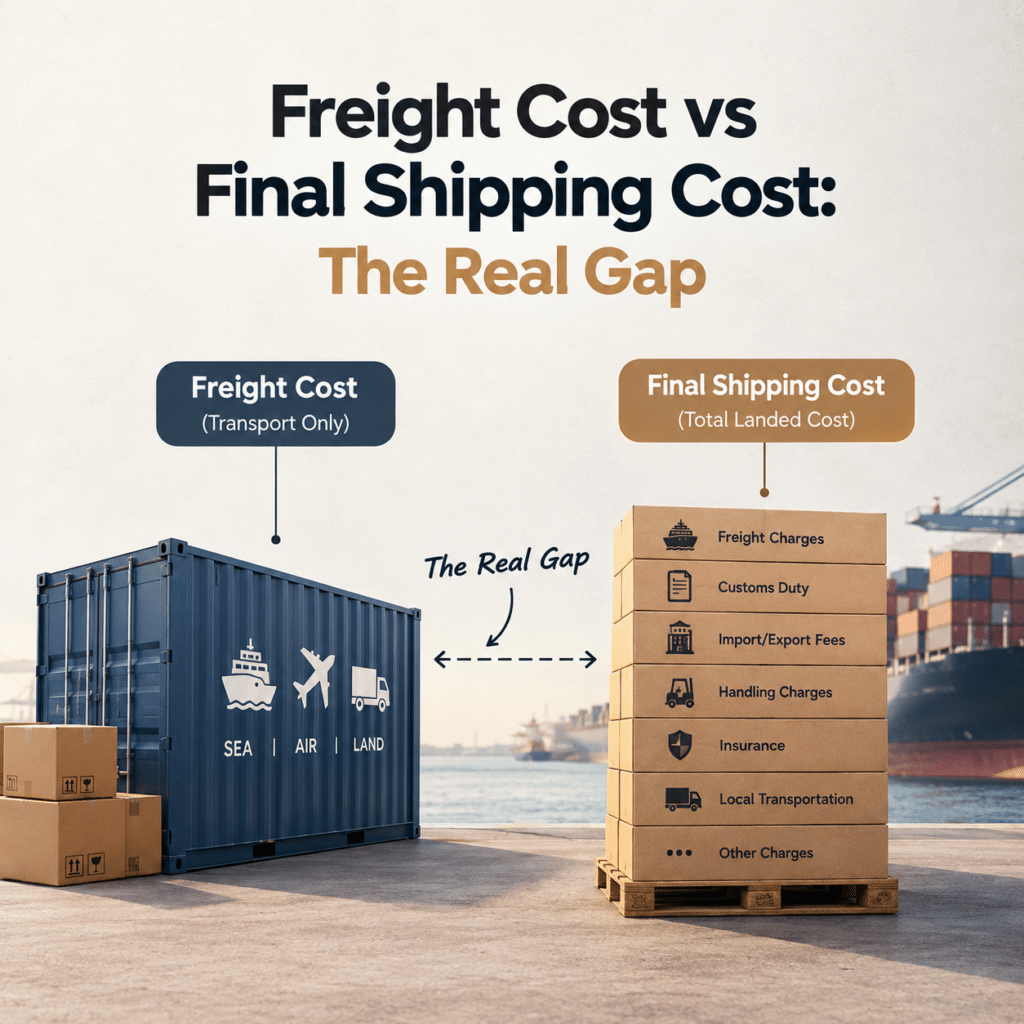
Freight Cost vs Final Shipping Cost: The Real Gap

A freight quote arrives; it gets built into a customer price, and everyone moves forward assuming that number is what shipping actually costs. Freight cost vs final shipping cost is exactly the gap that turns a confidently quoted shipment into a smaller margin than expected, and 2026 freight data shows just how routinely, and how significantly, that gap opens up. Why the Quoted Rate Is Only Part of the Bill The base ocean freight rate, the number most people mean when they say freight cost, typically represents only 60 to 80 per cent of what actually ends up on the final invoice. Freight forwarders describe surcharges inflating a quoted total by 5 to 20 per cent as routine, and real invoice disputes show the gap running even wider: a client approving a quote of 2,000 dollars can receive a final bill of 2,800 dollars, a 40 per cent increase buried in surcharge codes most shippers never learn to read. Freight cost vs final shipping cost isn’t a rare billing error. It’s the predictable result of a quoting system built around a base rate that was never meant to represent the full cost on its own. The Fuel Surcharge That Moves With Oil Prices The single largest variable surcharge is tied directly to fuel markets, and it moves independently of anything an exporter controls. The Bunker Adjustment Factor, covering the low-sulfur marine fuel that powers container vessels, typically adds 200 to 600 dollars per container, or 10 to 30 per cent of the base freight rate, and in the first quarter of 2026 alone, volatile fuel prices drove BAF hikes of 20 to 50 per cent on major trade lanes before easing somewhat in the following months. A rate that was accurate when quoted can be materially wrong within weeks if fuel prices move before the shipment actually sails, since BAF is typically adjusted on a recurring schedule rather than locked in at the moment of booking. The Terminal and Currency Charges Layered on Top Beyond fuel, two more charges apply almost universally and rarely appear in a headline freight quote. Terminal Handling Charges, covering the cost of loading and unloading a container at port, typically run 100 to 350 dollars per container at each end of the journey, origin and destination separately, while the Currency Adjustment Factor adds another 2 to 5 per cent to compensate the carrier for exchange rate movement between the freight rate’s quoted currency and its own operating currency. Neither of these is optional or negotiable in most cases, and both apply regardless of how favourable the base rate looked at the time of booking. Peak Season Turns a Predictable Cost Into a Guessing Game Timing adds its own layer of unpredictability on top of the surcharges that apply year-round. Peak Season Surcharges and Congestion Surcharges, applied during high-demand windows, commonly August through October for Asia-to-US trade lanes, can add 250 to 2,000 dollars per container, and peak season rates overall run 40 to 80 per cent higher than the cheapest booking window, typically the first quarter following Chinese New Year. An exporter pricing a shipment based on a rate quoted during a quiet month can find that same route considerably more expensive by the time the actual booking happens during a seasonal surge. Why the Same Route Can Produce Wildly Different Final Bills A large share of this unpredictability comes down to one distinction most exporters never think to ask about directly: whether a quote is genuinely all-in or merely a base rate subject to surcharges. An All-In rate bundles the base rate, BAF, CAF, and low-sulfur surcharge into one fixed number, offering real price certainty, while a rate quoted as Subject to Surcharges shows only the base, with the final bill assembled from whatever surcharges apply by the time the shipment actually moves. Two forwarders quoting what looks like the same base rate can produce meaningfully different final invoices depending purely on which of these two quote types was used, which makes this one question worth asking on every single freight quote before it gets built into a customer price. LCL Shipments Carry the Same Problem in a Different Package Exporters shipping less than a full container face a version of this same gap, structured slightly differently but no less significant in proportion. A quoted LCL base rate of roughly 50 dollars per cubic meter can turn into 100 to 150 dollars per cubic meter once Container Freight Station handling fees at both origin and destination, running 15 to 40 dollars per cubic meter each, along with THC, BAF, CAF, and documentation fees, are actually added in. LCL quotes in particular tend to bury these charges deepest, since consolidated shipments pass through more distinct handling steps, each with its own fee, than a full container moving directly from origin to destination. An LCL quote that looks meaningfully cheaper than an FCL alternative on the base rate alone can lose most or all of that advantage once every layer of the actual invoice is accounted for. What a Full Landed Cost Actually Looks Like Put together, these layers add up to a total considerably larger than the freight line item alone. A full landed cost example for a 40-foot high-cube container from Qingdao to Rotterdam in 2026 runs 6,500 to 8,200 dollars, covering base ocean freight, BAF, an emergency or peak-season-linked surcharge, terminal handling at both ends, documentation fees, and insurance, before duties and VAT are even added on top. Freight cost vs final shipping cost, measured this way, isn’t a small rounding difference. It’s frequently a gap wide enough to turn a quote that looked profitable into one that barely breaks even once every applicable charge is actually included. Who Actually Pays Depends on the Incoterm All of this only matters financially to the party actually responsible for paying it, and that responsibility shifts entirely based on the Incoterm the deal was quoted under. Under EXW terms, the buyer absorbs every charge described

Blog

Income vs Financial Security: Why They Are Not the Same

A rising paycheck feels like it should translate directly into feeling safer financially, and for a long time the assumption was that it mostly did. Income vs financial security has started pulling apart in the data in a way that contradicts that assumption directly, with the most recent national survey showing insecurity climbing fastest among precisely the earners who should, on paper, be the most protected from it. The 2026 Data Behind Income vs Financial Security The clearest evidence comes from a survey specifically designed to track this feeling over time. The AARP Financial Security Trends Survey, conducted by NORC at the University of Chicago among 6,736 adults age 30 and older, found 42 per cent of respondents feeling financially insecure in January 2026, up from 40 per cent in January 2025 and 39 per cent in January 2022, with the increase over that period concentrated specifically among households earning $75,000 to $99,000 and $100,000 or more. That last detail is the one worth sitting with. This isn’t insecurity rising among people earning less. It’s rising fastest among people whose income would have been considered comfortably secure by almost any older benchmark. Why Insecurity Is Climbing Fastest Among Higher Earners The same survey points toward a specific mechanism behind that shift rather than leaving it unexplained. More than seven in ten adults age 30-plus, 72 per cent, remain worried about prices rising faster than their income, and many respondents reported monthly expenses higher than the previous year specifically for essentials: food, housing, health care, and transportation. A higher income doesn’t insulate a household from this pattern if the cost side of the ledger is rising in step with it, or faster. Income vs financial security breaks down precisely at the point where a bigger paycheck stops outrunning the bigger bills attached to the lifestyle and location that paycheck typically comes with. Net Worth Is the Actual Measurement, Income Is Just an Input Financial researchers increasingly treat income and security as measuring genuinely different things, not two versions of the same number. Analysis based on Federal Reserve Survey of Consumer Finances data makes the distinction directly: someone earning 250,000 dollars a year but carrying high debt and spending aggressively can end up with lower net worth than someone earning far less who has saved and invested consistently for years, since net worth reflects what’s actually been built, accounting for debt, rather than what’s been earned in any given year. A high earner who retires with limited savings still has to replace that income from somewhere. A more modest earner who has built substantial assets has far more flexibility, precisely because net worth, not income, creates options when circumstances change. What ‘Financially Secure’ Actually Costs in Dollar Terms It’s worth putting an actual number on what people mean when they say secure, since the figure has shifted recently and is more modest than the headline wealthy threshold most people fixate on. Charles Schwab’s 2025-2026 Modern Wealth Survey found Americans now peg the net worth needed to feel wealthy at 2.3 million dollars, down from 2.5 million in 2024, while the threshold for feeling merely financially comfortable sits considerably lower, around 839,000 dollars. These are self-reported perception numbers, not literal requirements, and they shift with regional cost of living and personal circumstances. But the gap between them is instructive: comfort and security sit at a fraction of what people associate with being wealthy, which means income vs financial security is a much closer, more attainable gap to close than the wealthy benchmark alone would suggest. Why Income Sources Matter as Much as the Total A separate thread in current financial research points toward income structure, not just income level, as part of what actually predicts security. Households increasingly draw income from more than one source, a base salary alongside freelance work, dividends, or rental income, and financial researchers tracking this shift argue that diversified income reduces the acute vulnerability of a single job loss in a way that a larger but single-source salary doesn’t. This matters directly for income vs financial security, since two households earning the identical total amount can carry very different risk profiles depending on whether that income depends entirely on one employer staying stable or is spread across several independent sources that don’t all fail at once. A high single salary is a bigger number. It isn’t automatically a more resilient one. The Buffer Even High Earners Skip One specific gap explains a large share of why income and security diverge so sharply in practice. Bankrate’s January 2026 report found 59 per cent of Americans cannot cover a 1,000 dollar emergency expense without borrowing, a figure that cuts across income brackets rather than being confined to lower earners, since a household with genuinely no liquid buffer feels the same acute vulnerability during a job loss or a medical bill regardless of what the prior year’s salary looked like. A high income that never converts into an accessible cash buffer produces exactly the kind of fragility the AARP data captures: a paycheck that looks secure on a resume but leaves a household one unexpected expense away from real financial stress. Financial Resilience Is Increasingly Framed as a Skill, Not a Number Financial advisors covering the 2026 economic environment have started shifting language away from a single dollar target and toward what’s being described as financial resilience, the ability to adapt spending, income, and debt decisions as conditions change, rather than depending on stability that current conditions no longer reliably provide. Rising costs, more volatile interest rates, and a less predictable job market have made a fixed budget built around stable prices and steady employment less reliable than it used to be. Under this framing, income vs financial security isn’t really a contest between two numbers at all. It’s a contest between a static plan built around a paycheck and a more adaptive set of habits, an emergency buffer, manageable debt, and more than one income source, built around the

Blog

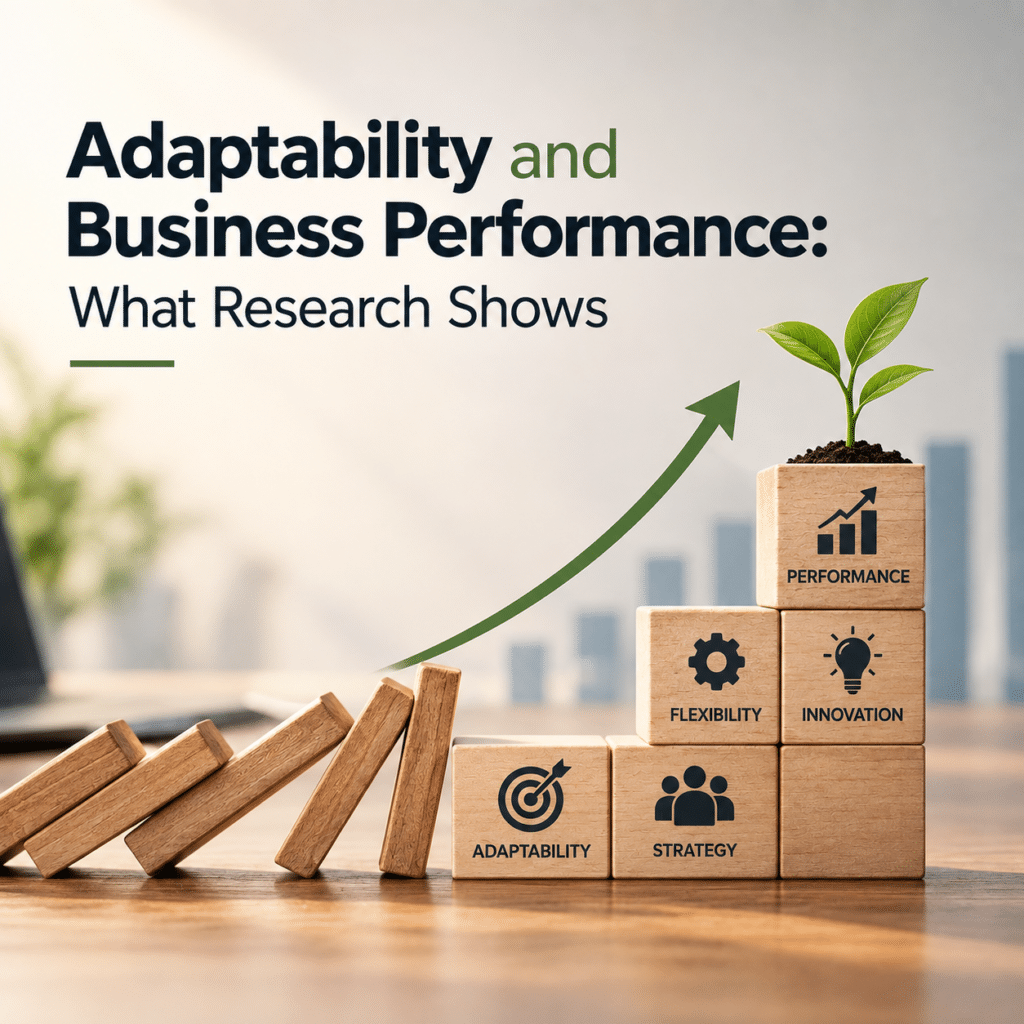
Adaptability and Business Performance: What Research Shows

Business consultants have insisted for years that adaptability drives performance, which is exactly the kind of claim that deserves a sceptical look rather than automatic acceptance. Adaptability and business performance have been tested statistically across dozens of studies and thousands of firms, and the honest answer is more nuanced than what consultants or sceptics usually present. What a Meta-Analysis Actually Found The most rigorous evidence comes from combining many individual studies into one statistical estimate, which smooths out the noise any single study carries on its own. A meta-analysis published in PLOS ONE, screening 6,436 studies down to 72 empirical ones, found organisational agility correlated with firm performance at r equals 0.31 to 0.33, a moderate, statistically real relationship rather than either a negligible one or an overwhelming one. In plain terms, a correlation in that range means adaptability is a genuine, measurable contributor to performance, but it’s one factor among several, not the single dominant driver some business books imply. Adaptability and business performance are connected. The connection just isn’t as overwhelming as the marketing language around organisational agility often suggests. The Direct Path From Adaptability to Performance More recent research has moved from simple correlation toward modelling the actual causal pathway. A 2026 study using structural equation modelling found that dynamic capability, the organisational ability to sense change and reconfigure resources in response, had a statistically significant direct effect on business performance, with a path coefficient of 0.600 and a t-statistic of 5.398, a result that clears the standard threshold for statistical significance comfortably. That’s a stronger, more specific finding than a broad correlation, since it isolates dynamic capability as a driver of performance while statistically accounting for other variables in the same model. It’s one of the clearer pieces of evidence that this isn’t just two things that happen to move together; there’s a demonstrable directional relationship between them. Why the Connection Runs Through Data and Decisions, Not Just Culture Adaptability is often described in vague, cultural terms- comfortable with change, open to new ideas- which makes it hard to study rigorously. Newer research has instead traced a more concrete mechanism. A 2025 meta-analysis published in Humanities and Social Sciences Communications found that organisational agility acts as a mediating mechanism between a company’s big data analytics capability and its financial performance, meaning better data infrastructure improves performance specifically by enabling faster, more adaptive decisions, rather than improving performance directly on its own. This matters practically: a company that invests heavily in data and analytics tools without building the organisational structure to act on what that data shows quickly is missing the actual mechanism that converts data into results. The technology alone doesn’t do the work. The adaptability built on top of it does. Human Capital Sits Underneath the Whole Chain It’s worth tracing the mechanism one layer further back, since adaptability doesn’t appear inside an organisation from nowhere. A 2026 study of corporate managers found strategic human capital had a significant positive effect on dynamic capabilities, with a path coefficient of 0.765, and dynamic capabilities in turn significantly predicted organisational agility, with a path coefficient of 0.582, tracing a full chain from workforce quality through organisational capability to the agility that ultimately correlates with performance. This adds a useful, practical layer to the adaptability and business performance question: agility isn’t a policy a company simply announces; it’s downstream of whether the organisation has actually built the underlying human capital and reconfiguration capacity needed to produce it in the first place. A company trying to become more adaptive without investing in the people and capability layer underneath it is skipping the part of the chain the research shows actually does the work. Startups Show the Same Pattern in a Different Setting The relationship isn’t confined to large, established firms either, and evidence from earlier-stage companies reinforces the same conclusion from a different angle. A synthesis of research on international startups found that dynamic marketing capabilities, paired with strong information management, correlated with faster growth, stronger market responsiveness, and a more durable competitive advantage across the ventures studied. That finding matters for the adaptability and business performance question specifically because startups operate with far less institutional inertia than large corporations, which means the relationship shows up more cleanly: a young company either builds the capacity to sense and respond to its market quickly, or it doesn’t, without decades of legacy process and culture complicating the picture the way it does at a mature enterprise. Seeing the same directional relationship hold in both settings, small and fast-moving as well as large and established, is part of what makes the underlying finding credible rather than an artefact of one specific type of company being studied disproportionately. The Correlation Isn’t Uniform Across Every Company It would be misleading to present this relationship as fixed and identical everywhere, since the same body of research finds it varies by context. The relationship between agility and performance has been shown to differ across national cultures, industries, and firm sizes, with some studies finding the link considerably stronger in fast-moving, technology-exposed sectors than in stable, slow-changing ones. A firm’s starting point matters too: a company already operating close to its industry’s competitive frontier gets less incremental benefit from additional agility than one that’s currently lagging and has more room to close a gap. Adaptability and business performance move together more strongly in some environments than others, which is exactly what a genuinely evidence-based claim should look like, rather than a universal law applying equally to every company in every market. What ‘Real’ Means Here: Effect Size in Context It’s worth being precise about what a correlation of roughly 0.3 actually implies, since the number itself can be misread in both directions. In social science and management research, a correlation in that range is generally considered a moderate effect, meaningfully different from zero and worth acting on, but far short of the kind of relationship where adaptability alone could be expected to explain most of the

Blog

How a Job Prepares You to Start a Business, By the Data

The image of a founder is usually someone who skipped the traditional career path entirely, but the actual research on who builds successful businesses tells a different story. How a job prepares you to start a business turns out to be one of the more thoroughly studied questions in entrepreneurship research, and the data consistently favours the person who spent real years working for someone else first. The Data Behind How a Job Prepares You to Start a Business The clearest evidence comes from a landmark study using US Census and IRS data covering 2.7 million founders. Research by MIT’s Pierre Azoulay and coauthors found the average founder age among the fastest-growing one-in-a-thousand new ventures was 45, and separately found that entrepreneurs were 125 per cent more successful when they had previously worked in the specific industry they went on to found a company in. Neither finding fits the popular image of the twenty-something dropout founder. Both point toward the same underlying mechanism: years spent employed inside an industry build something a great idea alone can’t replace. Why Industry-Specific Experience Matters So Much The advantage isn’t vague or hard to explain once it’s broken down. Research from Nanyang Business School found startups founded by people with related prior industry experience consistently perform better because those founders already understand market trends, customer needs, and competitive dynamics before they ever write a business plan. A job inside an industry is, in effect, years of paid market research: which customer complaints are common, which processes are inefficient, which competitors are vulnerable, and which parts of the industry’s standard playbook are actually wrong. None of that shows up on a resume as a skill, but it’s precisely the knowledge a founder needs to identify a real gap rather than guess at one from the outside. The Specific Skills a Job Actually Builds Beyond industry knowledge, ordinary employment builds a set of concrete, transferable capabilities that new founders often have to learn the hard way if they skipped this stage. Negotiating a vendor contract, managing a budget against a hard ceiling, hiring and giving feedback to a direct report, handling a genuinely upset customer, and running a project against a deadline with resources that keep shifting are all skills a job forces someone to practice repeatedly, in a setting where the consequences of a mistake are contained rather than existential. A first-time founder who has never managed a budget, negotiated a contract, or given a direct report difficult feedback is learning all of those skills for the first time at exactly the moment the business can least afford the mistakes that come with a first attempt. Where Job Experience Can Become a Liability It would be dishonest to present this as an unqualified benefit, since the same research identifies a genuine downside. Industry experience helps most in a startup’s early stages, but its positive impact diminishes over time as the founding team accumulates new, venture-specific knowledge, and in some cases prior experience becomes a liability, producing overconfidence and reduced flexibility exactly when a startup needs to pivot away from what worked at a previous employer. How a job prepares you to start a business isn’t a guarantee that more years of experience is always better. A founder who spent fifteen years doing things one company’s way can struggle precisely because they’re too certain that way is the only way, which is its own kind of risk a completely inexperienced founder doesn’t carry. Background Isn’t Everything, and That’s Worth Being Honest About It’s worth adding one more genuine caveat rather than overselling this pattern. A 2025 analysis of more than 4,300 Y Combinator companies found founder background explained less than 4 per cent of the variation in how much funding a startup ultimately raised, and prior experience at a large, well-known tech company specifically was not a reliable predictor of funding outcomes at all, with the effect reversing direction depending on how the analysis was run. That doesn’t contradict the industry-experience research above, since funding raised and long-term business success are genuinely different outcomes, but it’s an important corrective to the idea that a prestigious employer name alone functions as a guarantee. What predicts success isn’t simply which company appears on a resume; it’s whether the specific years spent there built real, applicable knowledge of the market the founder eventually enters. Why a Mix of Experience Beats One Type Alone Research specifically on founding teams adds an important nuance to the industry-experience finding. A University of Wisconsin study using Census Bureau employment data found startups with a combination of founders holding different types of prior experience, some with experience across multiple firms, others with shared experience working together at the same previous company, had meaningfully better odds of long-term survival than teams built around a single experience profile. This lines up with a broader pattern in the founder-background research: diversity within a founding team’s collective experience tends to outperform uniformity, since different backgrounds cover each other’s blind spots in a way that a team built entirely from the same prior employer or the same functional background can’t. Why Middle-Aged Founders Keep Outperforming Younger Ones It’s worth returning to the age finding directly, since it’s often misread as a claim about biology rather than about accumulated experience. The Azoulay research isn’t suggesting people become inherently better entrepreneurs as they age; it’s showing that the specific advantages built up over a longer career, deeper industry knowledge, a larger professional network, more capital saved to self-fund an early stage, and more management experience, happen to accumulate with time spent employed. A separate University of Glasgow study of Scottish tech startups found ventures founded by mid-career professionals coming from established companies were more likely to become high-growth firms than university spinoffs, specifically because those founders had already built real relationships with end users and customers during their time in traditional employment. Age itself isn’t the mechanism. Years spent building exactly the kind of experience described throughout this piece are.

Scroll to Top